Downstream Services for Rice Crop Monitoring in Europe: From Regional to Local Scale – a JSTARS paper out
Earlier in 2017, the ERMES consortium submitted a joint paper to the IEEE Journal of Selected Topics in Applied Earth Observations and Remote Sensing (JSTARS) in response to a special issue on “Advances in Agro-geoinformatics Research and Applications”. The work done in the ERMES project perfectly matched the scope of the special issue. The paper was jointly written by many (35 co-authors) but coordinated by CNR, and it is finally out one year later. It is part of a set of 9 articles ranging from agricultural monitoring to prediction and decision support, representing the state of the art in agro-geoinformatic research and applications.
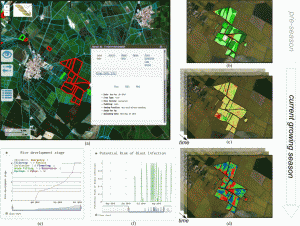
The article aims to provide an easy to understand introduction to the range of contributions, products and tools derived from the ERMES project (see figure below as example of products and tools at local scale), without going into details which would otherwise require an entire paper for each individual contribution. It is a reference paper of the ERMES project, as it provides a gentle introduction to the motivation and aims of the project, a description of the input data sources and how they are transformed into timely information for rice crop management on the regional and local scales, the dissemination tools to deliver this timely information to end stakeholders, and ends with real-world applications of the ERMES products and services in three European rice-producing countries (Italy, Spain, and Greece) during rice growing seasons 2015 and 2016.

The above figure (extracted from the paper) shows examples of information retrievable from ERMES local Geoportal:
- Interface of the local Geoportal (a), with rice fields belonging to the user highlighted (red ones correspond to fields with active alerts), and interface for visualization of information collected and supplemented by the AgriNotebook app.
- Constant Pattern map (b) for a farm in the Italian local study area (b), where different colors correspond to different clusters identified in each field as a function of soil and biomass persistent patterns.
- Seasonal pattern maps (c) from Cosmo-SkyMed (CSK) at 3-m resolution for 03/04/2016 (different colors are linked to anomalies in backscatter signal with respect to the field average), and
- RapidEye (d) for 14/06/2016 (red, green, and blue colors correspond, respectively, to below-average, average, and above-average status).
- For each of its parcels and field, a farmer can visualize time series of simulated crop development stage (e) and rice blast infection risk (f).
Its full citation is:
L. Busetto, S. Casteleyn, C. Granell, M. Pepe, M. Barbieri, M. Campos-Taberner, R. Casa, F. Collivignarelli, R. Confalonieri, A. Crema, F.J. García-Haro, L. Gatti, I.Z. Gitas, A. González-Pérez, G. Grau-Muedra, T. Guarneri, F. Holecz, D. Katsantonis, C. Minakou, I. Miralles, E. Movedi, F. Nutini, V. Pagani, A. Palombo, F. Di Paola, S. Pascucci, S. Pignatti, A. Rampini, L. Ranghetti, E. Ricciardelli, F. Romano, D.G. Stavrakoudis, D. Stroppiana, M. Viggiano, M. Boschetti. Downstream services for rice crop monitoring in Europe: from regional to local scale. IEEE Journal of Selected Topics in Applied Earth Observations and Remote Sensing, 10(12), 5423-5441, 2017.
DOI (http://dx.doi.org/10.1109/JSTARS.2017.2679159)
Preprint (http://repositori.uji.es/xmlui/handle/10234/169280)
- Posted by geoadmin
- On 9 January, 2018
- 0 Comments


0 Comments