Digital Phenotyping explained graphically
When we talk about mental health, each patient is a world. Recent research goes through the creation of individualized therapies and is aimed at the particularities of each patient. Technology and advanced software tools such as apps for the passive collection of sensory data are a reality to put the concept of Digital Phenotyping into practice.
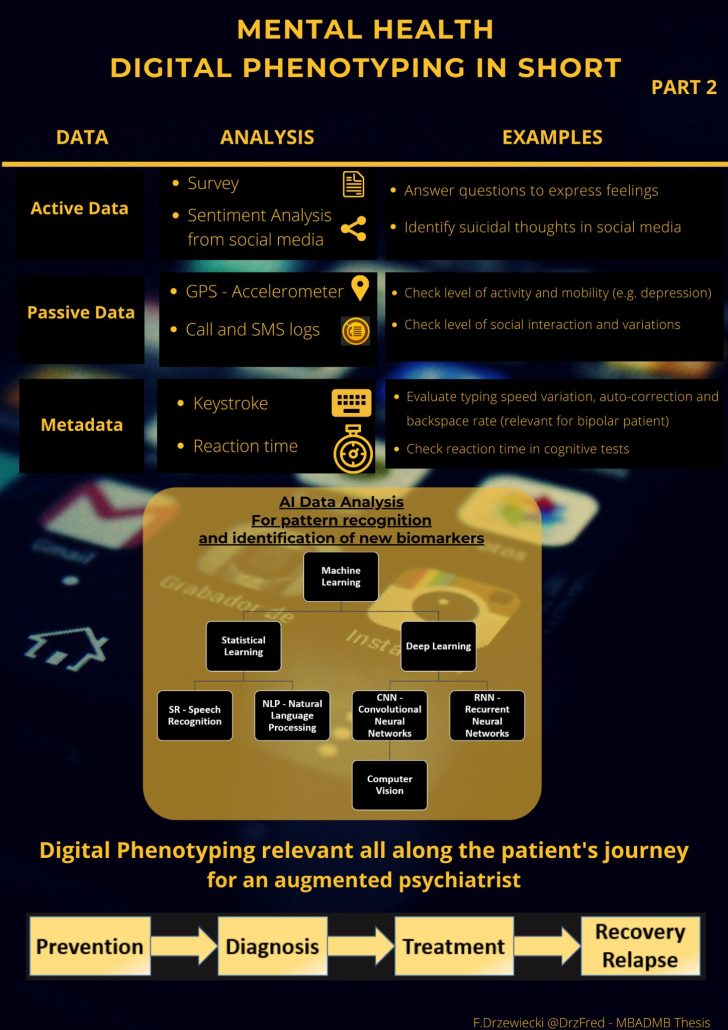
A series of tweets from Frederic Drzewiecki shows a couple of infographics that briefly summarize the key points of Digital Phenotyping applied to mental health.
In the infographic above, digital phenotyping is emplaced as the observable and quantifiable digital traces which are an open door to study the manifestation of the genotype. What are those digital traces that can be captured with mobile devices? Well, physical activity, emotions, feelings, tone of voice, mobility, sleep pattern, etc… all these human actions are sources of information that by themselves do not contribute much, but when properly combined and analysed , they provide reliable indicators or markers, individualized to each patient in particular, that allow monitoring or predicting the prevalence of symptoms associated with mental health disorders.
Data analysis is the focus of the second infographic by Frederic Drzewiecki. Some sources refer to passive data, captured through mobile devices. Others are active, when the patient is asked directly to collect information via questionnaires, for example. The research community uses machine learning techniques to create these digital indicators and markers linked to symptoms and clinical states of mental health disorders.
- Posted by geoadmin
- On 9 May, 2022
- 0 Comments


0 Comments